
Report Writing
The mind map
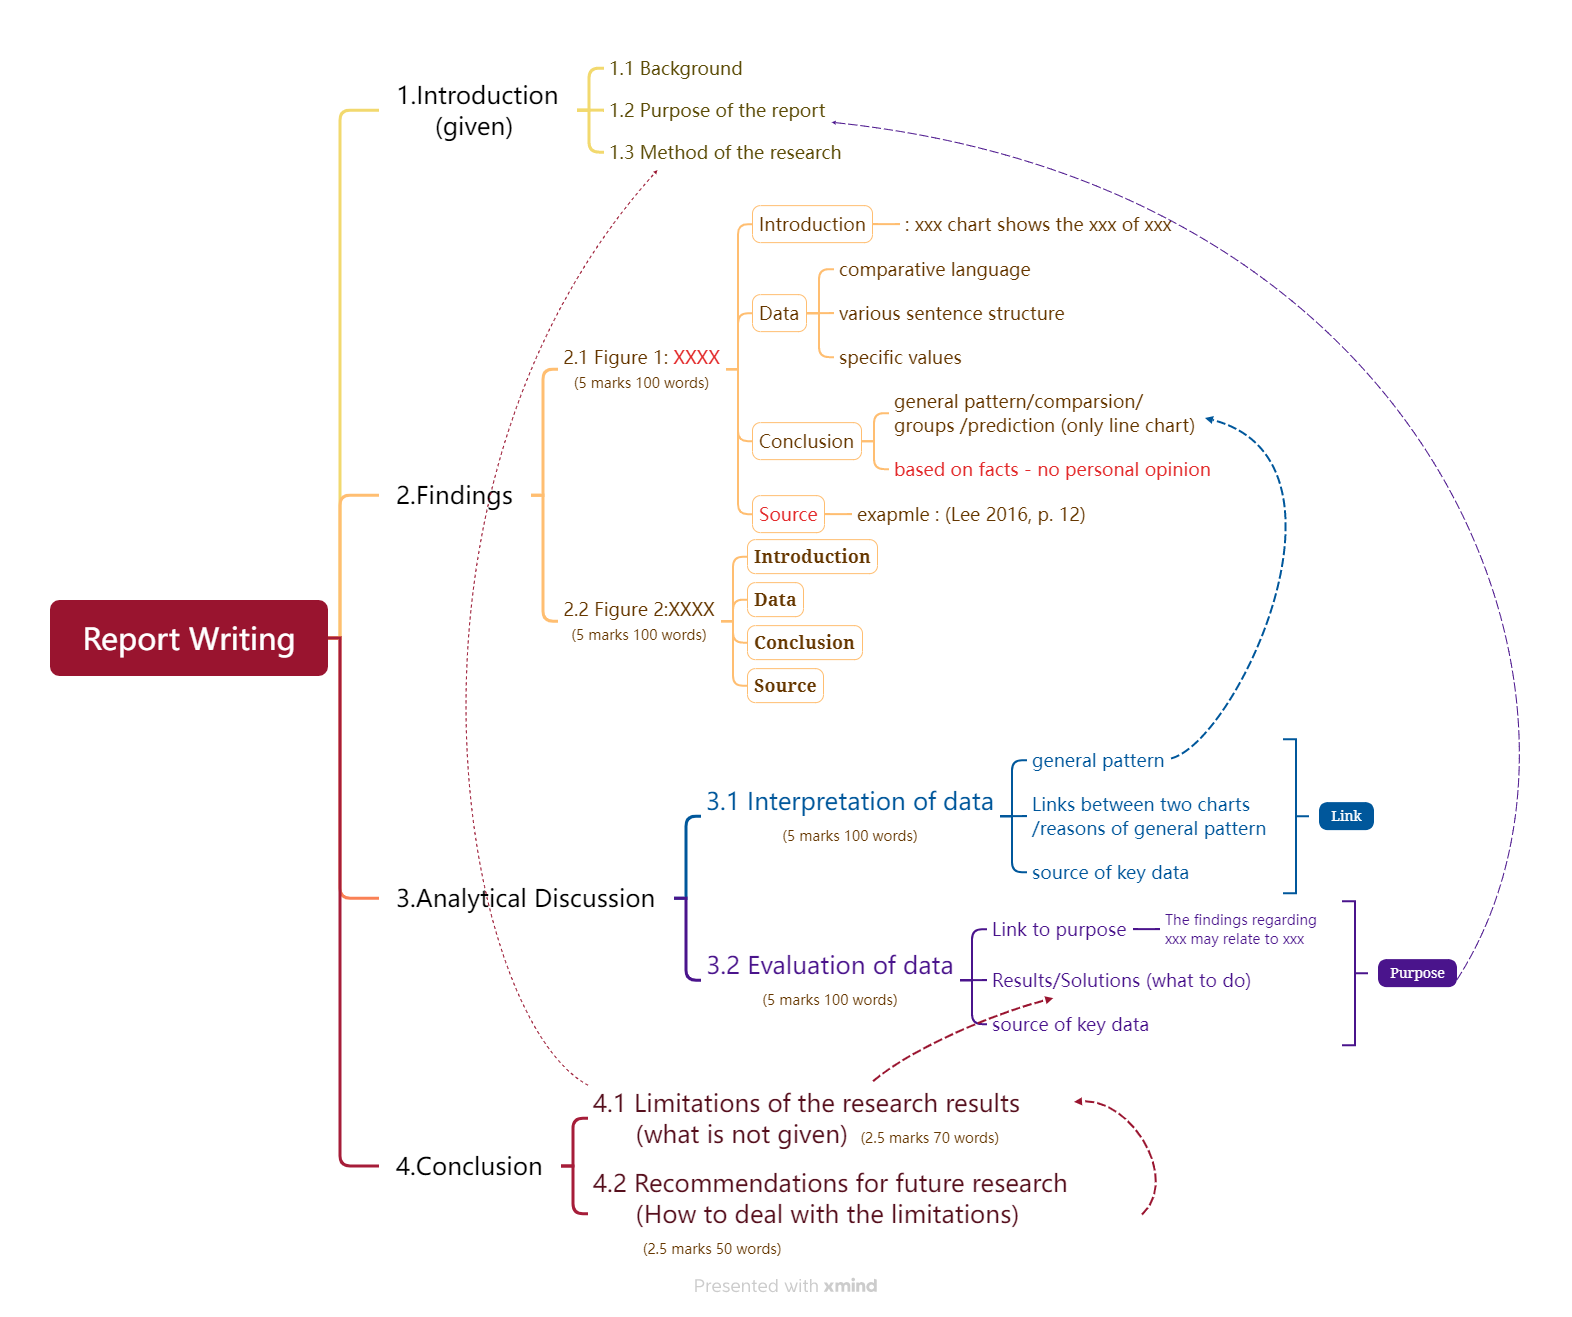
Report Writing Methods
Exam Sections for This Test
1. Introduction (Given)
- Includes:
1.1 Background
1.2 Purpose of the report
1.3 Method of the research - No need to write this section.
2. Findings
Problem-Solving Approach
- Read the chart/table carefully to identify key information, such as categories, numbers, and trends.
- Look for overall patterns (e.g., growth, decline, stability).
- Compare different categories or time periods to identify significant differences or similarities.
- Summarize the findings in a clear and logical order, starting with the most prominent feature.
Tips
- Focus on key data points (e.g., highest/lowest values, significant changes).
- Use objective and neutral language (e.g., avoid words like “interesting” or “surprising”).
- Avoid including personal opinions or assumptions that are not supported by the data.
Template
Figure [X] Title: [Provide a descriptive and specific title, e.g., “Trends in Student Enrollment by Type (2008-2014)”]
Description:
- Overview: The [chart/table] illustrates [main topic, e.g., “the number of students enrolled at Tuba University by type”].
- Main Findings:
- Highlight the most prominent trend, e.g., “Full-time students showed a steady increase from 1,000 in 2008 to 1,900 in 2014.”
- Include additional comparisons, e.g., “Distance students experienced the most significant growth, overtaking part-time students by 2014.”
- Specific Data Points: Mention key values or percentages to support the trends identified, e.g., “Part-time students rose from 800 in 2008 to just under 1,200 in 2014.”
Conclusion: Conclude with a brief summary of the trends, e.g., “Overall, full-time students remained the largest group, while distance students experienced the most dramatic growth.”
Line Chart
| Category | Verbs |
|---|---|
| Ups | increase / climb / grow / rise / go up / soar / rocket / surge |
| Downs | decrease / drop / fall / decline / go down / plunge |
| Stability | remain / stay / keep stable / the same / unchanged |
| Ups and downs | experience rises and falls / ups and downs; fluctuate / vibrate |
| Special value | reach the peak; hit the bottom |
| Cross point | overtake; outnumber; surpass; exceed |
3. Analytical Discussion
3.1 Interpretation of Data
Problem-Solving Approach:
- Identify the general patterns in the data.
- Analyze links between the two charts or figures.
- Provide reasons for the observed general patterns using the links.
- Reference the source of key data when explaining trends.
Tips:
- Clearly identify cause-effect relationships or correlations.
- Highlight how the two charts mutually reinforce conclusions to add depth to the interpretation.
- Avoid personal assumptions and focus on evidence provided in the figures.
Template:
- General Pattern: Describe the overall trend, e.g., “The findings show that students’ homes were the most popular choice of location for doing research in 2014(Lee 2016, p. 12)”
- Links Between Charts: Explain how the two charts support each other
- Reasons for Pattern: Provide logical explanations for the trends, using the links between each other.
- Source of Key Data: Reference the source, e.g., “(Lee 2016, p.12)”
3.2 Evaluation of Data
Problem-Solving Approach:
- Discuss the implications of the findings in relation to the report’s purposes.
- Clearly separate results (what the data shows) and solutions (proposed actions).
Template:
Implications for Purpose: Explain how the findings relate to the report’s purposes:
- “The findings regarding students’ choices of location for the purpose of conducting research may have some impact upon the way student support services are organised and made available at the University of Tuba.”
Results: Summarize what the data indicates:
- “Students prefer home-based research due to its convenience and the rise in distance learning programs.”
- “On-campus facilities such as libraries remain important for full-time students, highlighting diverse needs.”
Solutions: Propose specific actions to address the findings:
- For Online Support: “Expand e-library access and develop user-friendly digital research tools to support distance learners.”
- For On-Campus Facilities: “Upgrade library infrastructure and provide additional study spaces to cater to full-time students.”
- General Initiatives: “Survey students regularly to gather feedback on their research needs and adjust services accordingly.”
Source of Key Data: Evaluate the data source:
- “(Lee 2016, p.12) indicates that students are researching online, so the university would need to provide substantial on-line support services for students.”
4. Conclusion
4.1 Limitations of Research Results
Problem-Solving Approach:
- Analyze limitations based on research methods, results, and proposed solutions:
- Methodological Gaps: Evaluate whether the methods in 1.3 fully address the research questions.
- Results Context: Identify missing context or explanations in the reported findings.
Clues:
- Depth
- Recent
- Autortity
- Sample
- Specific data
- Process
Template:
State Limitations: “The research is limited by…”
- Example: “The methodology did not include direct feedback from students, relying instead on secondary data sources.”
- Example: “The reported results lack context regarding why certain locations, such as home-based research, are preferred.”
Impact on Findings: “This affects the findings because…”
- Example: “Without primary data, the conclusions may not fully capture the challenges faced by students.”
- Example: “The lack of explanation for research preferences limits the applicability of proposed solutions.”
4.2 Recommendations for Future Research
Problem-Solving Approach:
- Propose recommendations that address the limitations identified in 4.1:
- For Methodology Gaps:
- For Context:
Template:
Addressing Methodology:
- “Further research is recommended in order to collect primary sources about female marital status,”
Providing Context:
- “thus providing more valid data to compare with actual changes in current Hume society.”
Examples
Findings
Table
eg. The table compares the number of residents born in the UK,China and India who live in Sydney and Melbourne.224,685 people who live in Sydney were born in China,which was more than those born in the U.K.with 180,245 or India with 130,573.However,the largest number of foreign born people from the three countries who live in Melbourne is from India with 161,078,followed by China with 155,998 and the U.K. with 133,300.Overall, more people who were born in the U.K,China and India live in Sydney than in Melbourne.(Irvine 2018,p.41)
Bar chart
eg. The bar chart compares the popularity of different locations chosen by students for carrying out their research. The highest number of students, around 515, did research at home. Amongst the locations at the university, the most popular was the university library with approximately 460 students, followed by the computer lab with about 355 students, and slightly fewer than 300 students using other locations on campus. The least popular choice, at around 270 students, was conducting research off campus in locations other than at home. Overall, studying at home was the most popular place for students, but more students preferred doing their research on campus than off campus (Lee 2016, p. 12).
eg. The bar chart compares the type of pets that are owned by people who are residents of Highcliff Apartments. Dogs and cats are the most popular pets at Highcliff Apartments with around 34 and 29 owned respectively. Birds are less popular than cats and dogs with approximately 17 animals kept, but lizards and snakes are the least popular pets with about 11 and 8 of them kept respectively. In conclusion, mammals are the most popular type of pet at Highcliff Apartments, followed by reptiles and birds (Irvine 2017, p. 41).
eg. The bar chart shows the comparison of spending on different sectors by the Australian government from 1950 to 2010. Health and defence spending increased significantly from around 10% and 12% in 1950 to about 26% and 24% in 2010 respectively. Education spending rose slightly from around 15% in 1950 to nearly 18% in 1970 before falling slightly to roughly 14% in 2010. Transport spending fell steadily from around 18% in 1950 to approximately 9% in 2010. In summary, health and defence spending in Australia increased to around half of the nation’s expenditure by 2010 (Statistics Australia 2012, p. 47).special bar chart
Line chart
eg. The line graph compares the fluctuations in trends in the numbers of different types of students enrolled at the University of Tuba from 2008 to 2014. The number of fulltime students rose significantly from about 1000 in 2008 to around 1900 in 2014. The number of part-time students was lower, at about 800 in 2008, but this increased considerably until 2010, after which it rose gradually to just under 1200 students in 2014. Although the number of distance students was only about 400 in 2008, this number rose rapidly to approximately 1500 students in 2014, overtaking the number of part-time students. While the increase in the number of distance learning students was the most dramatic, the largest group of students remained that of full-time students (Lee 2016, p. 13).
eg. The line graph examines the trends in the annual small, medium and large car sales for March Motors from 2010 to 2018. Small car sales at March Motors rose steadily from around 9,500 in 2010 to just under 25,000 in 2016, where it levelled off until 2018. Medium car sales remained steady at approximately 17,500 from 2010 to 2016 before falling suddenly to around 12,500 sales in 2018. There was a sharp increase in large car sales from about 5,000 in 2010 to a peak of approximately 16,000 in 2014, which was followed by a dramatic decrease to about 3,000 in 2016. To summarise, total car sales for March Motors increased from 2010 to 2014 before starting to fall continuously from 2016 to 2018 (Stephens 2018, p. 51).
eg. The line chart shows different age groups of Australians and their average weight between 1950 and 2010. During this period, children under 13 and teenagers between 14-19 experienced more than 10 kg average weight gain from 24 to 36 kilograms and 45 to 57 kilograms respectively. The average weight of adults between 20-39 and 60+ also increased slightly. Adults between 40-59 years of age made up the heaviest group of Australians, remaining steady at 70 kilograms until 1990, after which their weight had a slight increase to 75 kilograms by 2010. Based on the above, the average weight of children and teenagers increased the most, while adults increased less (Statistics Australia 2012, p. 72).
Pie chart
eg. The pie chart displays the percentage of people in different age groups getting news from the internet. The majority people, making up 40% of the whole, getting news from the internet are between 19 to 40 years old. The next biggest group is the young people of 15 to 18 years old, with 35%. For the people between the ages 41 to 55, the percentage is 15%. The smallest group, 10%, is the people who are above 55 years old. Based on the above, majority people getting news from internet are between 15 to 40 years old, making up 75%. (Young 2014, p. 6)
eg. The pie chart displays the percentage of people in different age groups getting news from the internet. At 37%, the biggest group of people getting news from the internet are between 31 to 40 years old. The next biggest group is the people of 19 to 30 years old with 29%, followed by 41 to 50 years old with 16%. The smallest groups are the oldest of over 50 years old and the youngest of 15 to 18 years old with 6% and 12% respectively. Based on the above, the majority people getting news from internet are between 19 to 40 years old, making up 66% (Young 2016, p. 48).
Analytical Discussion
Interpretation
eg. The findings show that students’ homes were the most popular choice of location for doing research in 2014(Lee 2016, p. 12). This could be partly because the number of distance students has increased dramatically(Lee 2016, p. 13). However, the popularity of the university library, computer lab and other on campus locations(Lee 2016, p. 12) suggest that on campus research is convenient for many students, particularly full time students, who are the largest group of students(Lee 2016, p. 12). Part time and distance students may be more likely to study off campus. Therefore, the popularity of various locations for research at the University of Tuba could be influenced by enrolment type.
eg. These findings show that there have been dramatic increases in the health expenditure (Statistics Australia 2012, p. 47) which may continue to grow if the current weight trends in Australia continue. [Link1] At the same time, there has also been an equally significant increase in the average weight of children over the same period (Statistics Australia 2012, p. 72) which may result in a number of health problems associated with excess weight such as obesity and heart disease. [Link2] In addition, the average weight of adult Australians has also continued to rise further supporting the fact that the health expenditure will continue to increase if the current weight trends of both adults and children in Australia continue unabated. [Link3]
Evaluation
eg. The important findings regarding changes in the marital status of women may have some impact on Hume society. The change in age of women’s first marriage and divorce indicate that women are spending more of their life unmarried in 2015 than in 1965. This may result in an increase in the number of single parent families or young families with older parents than in the past. Women in Hume see both relationships and having children as more important than getting married, so this may lead to an increase in the number of families with a single parent or step-mother or father. As a result of these trends, social services in Hume may need to focus on a much broader definition of the family than may have been expected in 1965. The prioritisation of employment and education by many women in 2015 suggests that issues such as work life balance, the provision of support such as parental leave and the availability of affordable childcare might need to be considered in order to address any impact of changes to marriage patterns on society and support the women of Hume.(With no source!!!)
eg. The findings regarding students’ choices of location for the purpose of conducting research may have some impact upon the way student support services are organised and made available at the University of Tuba. The fact that they are doing research outside of the university library(Lee 2016, p. 12) indicates that students are researching online, so the university would need to provide substantial on-line support services for students, in addition to the apps already provided. However, since more students study on campus, such as the library, the computer lab and other unspecified places(Lee 2016, p. 12) , individual personalised services should also be provided for effective support. Moreover, the study environment in each location should be made appealing and supportive in order to maximise the potential of students.
eg. The findings regarding the change on average weight of Australians may have some negative effects on people’s health/society. The changes can be seen in the impact that these changes have had on health. As the number of children, teenagers, young adults and adults who are overweight continues to increase (Statistics Australia 2012, p. 72), the Australian government may be forced to increase health spending in order to provide more doctors, nurses and hospitals. As health expenditure is already increasing dramatically (Statistics Australia 2012, p. 47), this could make less money available to the government to spend on other important sectors such as education and transport. If the quality of education falls, this could impact society as there will be fewer highly qualified workers available, and this may result in an increase in unemployment as fewer people have the necessary qualifications to find work.
Conclution
Limitations of the research results
eg. The research has some limitations. Firstly, although information has been provided about the locations chosen by students, there is no detail about the difficulties that students may face when conducting their research. Without this information the university might not develop support services that could benefit students. Secondly, it is clear that studying at home or off campus is popular among students, but it is not clear why this is the students’ preference. Understanding these preferences would enable the university to further determine where to focus these support services to facilitate the students’ learning.
eg. There are two factors which limit the research.Firstly, only secondary sources about the marital status of a number of women are collected. No details were given showing how the data from Young’s research was collected. As a result, the data in the report may not provide a complete understanding of the issues of women’s marriage and employment in Hume.Secondly, another limitation in the research is the number of sources collected.The analysis of the research findings is based on only one report, which does not cover enough detail to help explain why the changes in female marital status have taken place.
eg. There are two limitations. Firstly, the report is limited in the scope of information provided. The findings show an increase in average weight in Australia and an increase in health spending, but it does not provide the details of why health expenditure is growing. As a result, the link between rising average weights and rising government expenditure on health can only be assumed. In addition, no information about the activities of any age group is provided or the reasons for this increase in weight over the time period. Such data about any changes in their lifestyle activities is directly related to their health status which would enable a better or more informed analysis of the findings.
Recommendations for future research
eg. Future research is recommended in order to determine the type of support that would most benefit students conducting research. In addition, research to determine what factors influence the choice of location for research should be carried out.
eg. ① Further research is recommended in order to collect primary sources about female marital status, thus providing more valid data to compare with actual changes in current Hume society.
② In addition, there should be more sources selected with different perspectives on the changes in female marital and employment status, so as to give a more detailed understanding of the issues involved.
eg. It is recommended that further research be conducted to the causes of the growing health expenditure to see how much of that growth is caused by weight-related issues. In addition, research on activities done by different age groups should also be done. This will allow researchers to fully understand the impact that Australia’s changing lifestyle has on its society.

